
Capabilities - Crowd Analytics
Crowd Analytics looks at how a crowd behaves as a whole: how dense it is, which way it is moving, where bottlenecks form and whether a dangerous surge is building. It is designed for wide, high camera views of large areas such as stadiums, plazas, transit hubs and festival grounds, where following each person is neither practical nor needed. It estimates headcounts where people overlap and maps the direction and speed of movement across the scene.
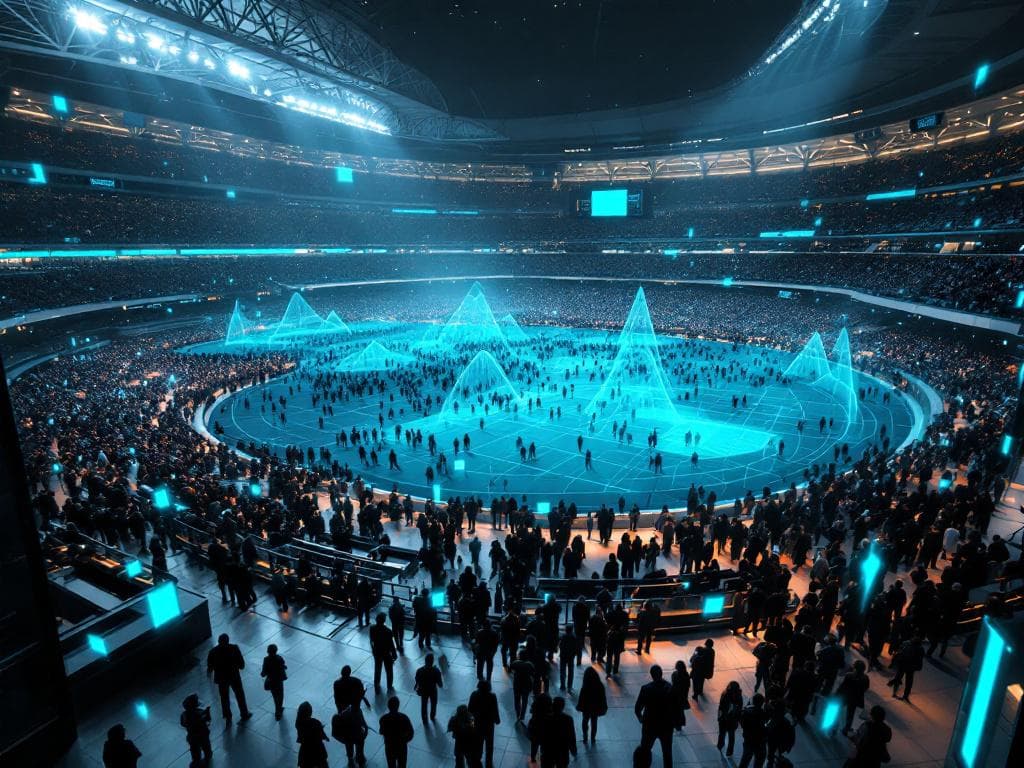
- Crowd Estimation
- Density Map
- Movement Analysis
- Flow Direction
- Safety Monitoring
- Surge Flags
How it works - Crowd Analytics in three steps
How Crowd Analytics works with the cameras you already run.
- Connect Elevated Cameras. Use your cameras that look over gathering areas from high up, such as on rooftops, poles or overhead structures. Wide-angle views cover more ground per camera. Drone video can cover temporary events.
- Estimate Density and Flow. The system estimates how many people are in each part of the view and keeps a live heat map. Arrows show which way and how fast the crowd is moving, and where flows meet or run against each other.
- Detect and Flag Anomalies. When density passes thresholds you set, flow reversals indicate a stampede risk, or crowd pressure builds at choke points, the system flags it for event management and public safety teams to review, with a severity level. Dashboards show density overlays on facility maps.
Features
What Crowd Analytics can do.
- Density Estimation. Estimates headcount per zone without counting people one by one. Designed for dense crowds where people overlap and block each other from view.
- Flow Direction and Speed Mapping. Shows the main directions of movement across the scene, people moving against the flow, and areas where the crowd has stopped moving.
- Surge and Crush Risk Detection. Monitors for conditions linked to crowd crush: rapidly increasing density, counter-flow collisions, and crowd pressure at barriers or choke points. Each flag carries a severity level that rises with the risk.
- Evacuation Monitoring. Tracks the progress of crowd evacuation from a venue or area, measuring outflow rates at each exit and showing camera views where people remain. Provides evacuation status to incident commanders.
- Zone Capacity Management. Set zones across a venue with a capacity limit for each. Live density readings help staff decide when to close entry to a full zone and send people to open areas.
- Historical Pattern Analysis. Records density and flow data over time to identify recurring patterns: peak arrival times, post-event exit surges, and congestion hotspots. Informs future event planning and infrastructure design.
- Drone-Based Temporary Coverage. For temporary events without fixed camera infrastructure, drone feeds provide aerial crowd analytics with the same density and flow capabilities as fixed installations.
Use cases
Applications of Crowd Analytics across industries.
Stadium and Arena Event Management
Large venues need to monitor crowd density across concourses, gates, and seating sections during events. Density maps can guide staff deployment and gate opening decisions, and identify sections approaching unsafe density.
- Events
- Hospitality
Transit Hub Congestion Management
Train stations and bus terminals experience surge conditions during rush hours and service disruptions. Density and flow analytics can trigger dynamic signage, gate control, and platform access management to distribute crowd load.
- Transportation
- Smart City
Festival and Open-Air Event Safety
Music festivals and public gatherings on open ground lack built-in crowd management infrastructure. Drone and tower camera analytics can provide the same crowd intelligence that fixed-venue systems offer, enabling safety teams to spot dangerous density buildups.
- Events
- Government
Retail and Shopping Center Traffic
Shopping centers need to understand pedestrian flow through corridors, atriums, and food courts. Crowd analytics can reveal high-traffic corridors, underutilized areas, and peak congestion times to inform tenant placement and wayfinding design.
- Retail
- Real Estate
Public Safety and Protest Monitoring
Public safety agencies monitoring large gatherings need density and movement data. Crowd analytics can provide situational awareness to incident commanders without requiring individual identification or facial recognition.
- Government
- Smart City
Theme Park Queue and Zone Management
Theme parks must balance crowd load across attractions, dining areas, and pathways. Density analytics can power dynamic wait-time displays, crowd-level flags for staff, and guest flow optimization throughout the park.
- Hospitality
- Events
Try Crowd Analytics at your site
A pilot runs on video from your camera system for an agreed period, and you get a report of the results.
Industries where this applies
Related capabilities
Contact us
Tell us which cameras you have and what you want them to watch for.
- Headquarters
ConductScience Inc.
5250 Old Orchard Rd Suite 300
Skokie, IL 60077
+1 (847) 983-3672 - Sales & Support
info@conductscience.com
Mon to Fri, 9 AM to 5 PM Eastern